Class 10 › Social Science › Economics — Understanding Economic Development Development Class 10 Social Science · Economics — Understanding Economic Development · Chapter 1
Practice all → Summary Questions & answers Practise this chapter → View all Page 1 free about 8 min read , Full kit about 55 min read Page 1 free about 8 min read , Full kit about 55 min read Page 1 free about 8 min read , Full kit about 55 min read Page 1 free about 8 min read , Full kit about 55 min read
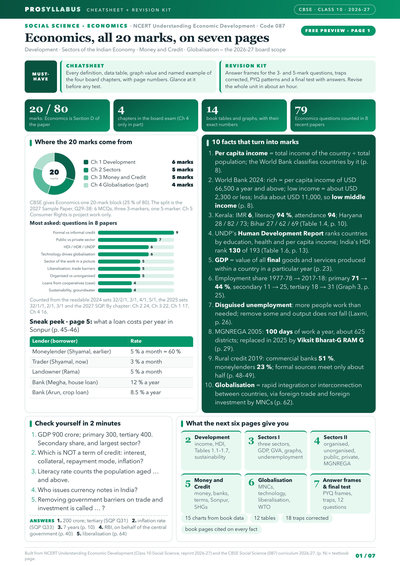
View all 12 amazing Marks Booster kits → This chapter introduces the idea of development and how it is measured. It begins by showing that different people have different developmental goals, and that what is development for one may be destructive for another. Besides higher income, people seek other goals such as equal treatment, freedom, security, respect and a good environment. The chapter explains how countries are compared using average or per capita income, but points out its limitations, since averages hide how income is distributed among people. It introduces broader measures of development used by the United Nations Development Programme’s Human Development Report, which combines income with health and education indicators such as literacy rate, net attendance ratio, life expectancy and the Human Development Index. The chapter also discusses public facilities like schools, clinics and clean water as essential for a good quality of life, and warns about the sustainability of development, since resources like groundwater and the environment must not be overused if development is to continue for future generations.
Development
Improvement in the income, quality of life and well-being of people.
Per capita income
The average income of a country, found by dividing national income by population.
Human Development Index
A measure combining income, education and health to rank countries.
Life expectancy
The average number of years a person is expected to live at birth.
Literacy rate
The proportion of the literate population aged seven years and above.
Infant mortality rate
The number of children who die before age one per 1,000 live births.
Sustainability of development
Using resources so that development can continue in the future.
National income
The total income of a country from all its goods and services.
Q1 Why do different people have different notions of development? Answer Q2 Why is per capita income used to compare countries, and what is its limitation? Answer Q3 What does the Human Development Index measure? Answer Q4 Why are public facilities important for development? Answer Q5 Why is the sustainability of development important? Answer Q6 Why do different people have different notions of development? Answer Q7 Why is per capita income used to compare countries, and what is its limitation? Answer Q8 What does the Human Development Index measure? Answer Q9 Why are public facilities important for development? Answer Q10 Why is the sustainability of development important? Answer Q1 Let us try to imagine what development or progress is likely to mean to different persons listed in Table 1.1. What are their aspirations? You will find that some columns are partially filled. Try to complete the table. You can also add any other category of persons. Answer Q1 1. Why do different persons have different notions of development? Which of the following explanations is more important and why? (a) Because people are different. (b) Because life situations of persons are different. Answer Q2 2. Do the following two statements mean the same? Justify your answer. (a) People have different developmental goals. (b) People have conflicting developmental goals. Answer Q3 3. Give some examples where factors other than income are important aspects of our lives. Answer Q4 4. Explain some of the important ideas of the above section in your own words. Answer Q1 Discuss the following situations: 1. Look at the picture on the right. What should be the developmental goals for such an area? Answer Q2 2. Read this newspaper report and answer the questions that follow: (i) Who are the people who benefited and who did not? Answer Q3 2. Read this newspaper report and answer the questions that follow: (ii) What should be the developmental goal for this country? Answer Q4 3. What can be some of the developmental goals for your village, town or locality? Answer Q1 If even the idea of what constitutes development can be varied and conflicting, then certainly there can be differences about ways of developing. If you know of any such controversy, try to find out arguments advanced by different people. You may do so by talking to different persons or you may find it from newspapers and television. Answer Q1 Based on data given in Table 1.2, calculate the average income for both the countries. Answer Q2 Will you be equally happy to live in both these countries? Are both equally developed? Answer Q1 1. Give three examples where an average is used for comparing situations. Answer Q2 2. Why do you think average income is an important criterion for development? Explain. Answer Q3 3. Besides size of per capita income, what other property of income is important in comparing two or more societies? Answer Q4 4. Suppose records show that the average income in a country has been increasing over a period of time. From this, can we conclude that all sections of the economy have become better? Illustrate your answer with an example. Answer Q5 5. From the text, find out the per capita income level of about \(10\)-\(15\) low-income countries as per World Development Reports. Answer Q6 6. Write a paragraph on your notion of what should India do, or achieve, to become a developed country. Answer Q1 1. Look at data in Tables 1.3 and 1.4. Is Haryana ahead of Kerala in literacy rate etc., as it is in terms of per capita income? Answer Q2 2. Think of other examples where collective provision of goods and services is cheaper than individual provision. Answer Q3 3. Does availability of good health and educational facilities depend only on amount of money spent by the government on these facilities? What other factors could be relevant? Answer Q4 4. In a study, it was found that in Tamil Nadu, \(90\) per cent of the people living in rural areas used a ration shop, whereas in West Bengal only \(35\) per cent of rural people did so. Where would people did better off and why? Answer Q1 Study Table 1.5 carefully and fill in the blanks in the following paragraphs. For this, you may need to make calculations based on the table. Answer Q2 (a) The literacy rate for all age groups, including young and old, is _____ for rural males and _____ for rural females. However, it is not just that these many adults could not attend school but that there are _____ who are currently not in school. Answer Q3 (b) It is clear from the table that _____ % of rural girls and _____% of rural boys are not attending school. Therefore, illiteracy among children in the age group \(10\)-\(14\) is as high as _____% for rural females and _____% for rural males. Answer Q4 (c) This high level of illiteracy among __________ age group, even after more than \(75\) years of our independence, is most disturbing. In many other states also we are nowhere near realisation of the constitutional goal of free and compulsory education for all children up to the age of \(14\), which was expected to be achieved by \(1960\). Answer Q1 One way to find out if we are properly nourished is to calculate what nutrition scientists call Body Mass Index (BMI). This is easy to calculate. Let each student in the class find out his or her weight and height. Take the weight of each student in kilograms (kg). Then, take the height by drawing up a scale on the wall and measuring accurately with the head straight. Convert the height recorded in centimeters into meters. Divide the weight in kg by the square of the height. The number you get is called BMI. Then, look at the BMI-for-Age tables given on pages \(90\)–\(91\). A student’s BMI could be within the normal range or less than that (underweight) or more (obesity). For example, if a girl student is \(14\) years and \(8\) month old and the BMI is \(15.2\), then she is undernourished. Similarly, if the BMI of a boy aged \(15\) years and \(6\) months is \(28\), then he is overweight. Discuss the life situation, food and exercise habits of students, in general, without body shaming anyone. Answer Q1 (a) Why groundwater is overused? Answer Q2 (b) Can there be development without overuse? Answer Q1 (a) Is crude oil essential for the development process in a country? Discuss. Answer Q2 (b) India has to import crude oil. What problems do you anticipate for the country looking at the above situation? Answer Q1 1. Development of a country can generally be determined by (i) its per capita income (ii) its average literacy level (iii) health status of its people (iv) all the above Answer Q2 2. Which of the following neighbouring countries has better performance in terms of human development than India? (i) Bangladesh (ii) Sri Lanka (iii) Nepal (iv) Pakistan Answer Q3 3. Assume there are four families in a country. The average per capita income of these families is \(Rs\ 5000\). If the income of three families is \(Rs\ 4000\), \(Rs\ 7000\) and \(Rs\ 3000\) respectively, what is the income of the fourth family? (i) \(Rs\ 7500\) (ii) \(Rs\ 3000\) (iii) \(Rs\ 2000\) (iv) \(Rs\ 6000\) Answer Q4 4. What is the main criterion used by the World Bank in classifying different countries? What are the limitations of this criterion, if any? Answer Q5 5. In what respects is the criterion used by the UNDP for measuring development different from the one used by the World Bank? Answer Q6 6. Why do we use averages? Are there any limitations to their use? Illustrate with your own examples related to development. Answer Q7 7. Kerala, with lower per capita income has a better human development ranking than Haryana. Hence, per capita income is not a useful criterion at all and should not be used to compare states. Do you agree? Discuss. Answer Q8 8. Find out the present sources of energy that are used by the people in India. What could be the other possibilities fifty years from now? Answer Q9 9. Why is the issue of sustainability important for development? Answer Q10 10. “The Earth has enough resources to meet the needs of all but not enough to satisfy the greed of even one person”. How is this statement relevant to the disscusion of development? Discuss. Answer Q11 11. List a few examples of environmental degradation that you may have observed around you. Answer Q12 12. For each of the items given in Table 1.6, find out which country is at the top and which is at the bottom. Answer Q13 13. The following table shows the proportion of adults (aged \(15\)-\(49\) years) whose BMI is below normal (\(BMI < 18.5\ kg/m^2\)) in India. It is based on a survey of various states for the year \(2019\)-\(21\). Look at the table and answer the following questions. (i) Compare the nutritional level of people in Kerala and Madhya Pradesh. Answer Q14 13. The following table shows the proportion of adults (aged \(15\)-\(49\) years) whose BMI is below normal (\(BMI < 18.5\ kg/m^2\)) in India. It is based on a survey of various states for the year \(2019\)-\(21\). Look at the table and answer the following questions. (ii) Can you guess why around one-fifth of people in the country are undernourished even though it is argued that there is enough food in the country? Describe in your own words. Answer Q1 Invite three different speakers to talk to you about the development of your region. Ask them all the questions that come to your mind. Discuss these ideas in groups. Each group should prepare a wall chart, giving reasons about ideas that you agree or do not agree with. Answer
Per capita income is found by dividing national income by:
A total exports B total population C the number of states D the number of workers
Flashcards & interactive practice