Statistics — Class 11 Mathematics
Mathematics · Chapter 13
CBSE Class 11 community
View all
 7
7- Mathematics
- Physics
- + 3 more
- Physics
- Chemistry
- + 3 more
 7
7- Accountancy
- Business Studies
- + 3 more
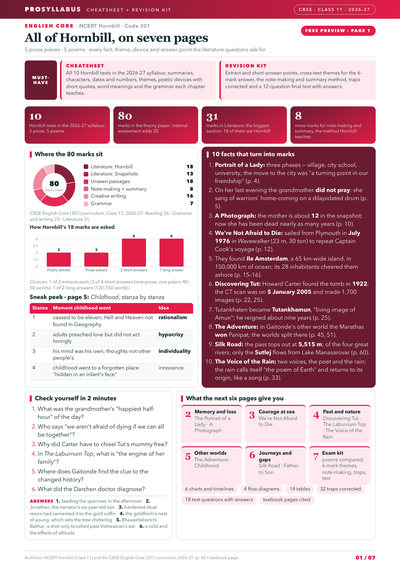
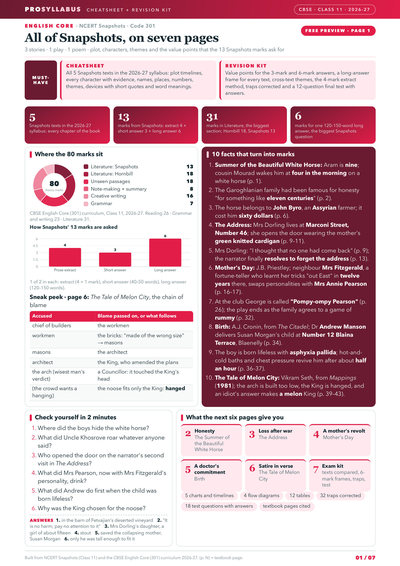
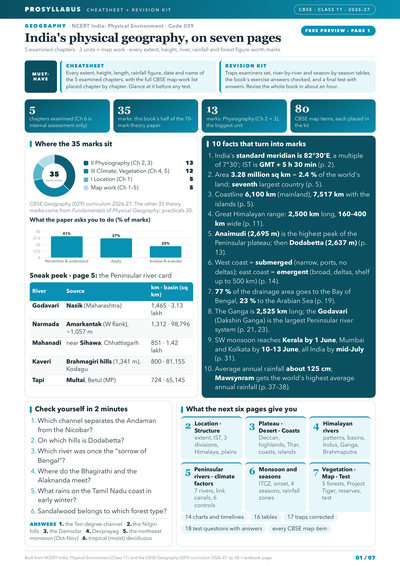
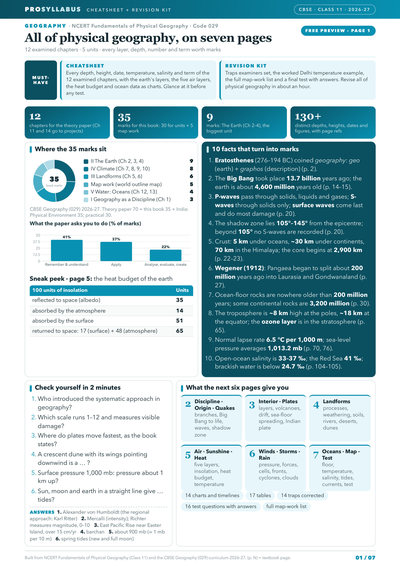
- Space weighted by unit marks
- Charts from the book's own data
- Traps corrected
- Accountancy
 2
2- हिंदी
 2
2- हिंदी
 2
2- Chemistry
 2
2- Political Science
 2
2- اردو
- Urdu Elective
 2
2- हिंदुस्तानी संगीत
 2
2- Home Science
 2
2- Hornbill
- Snapshots
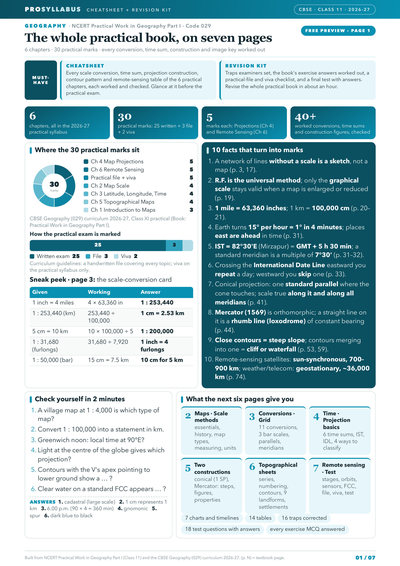 3
3- Geography
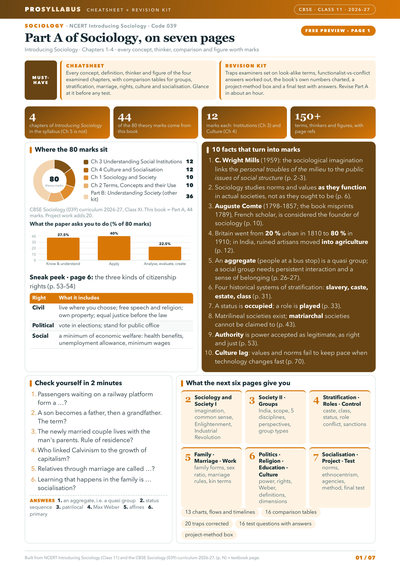
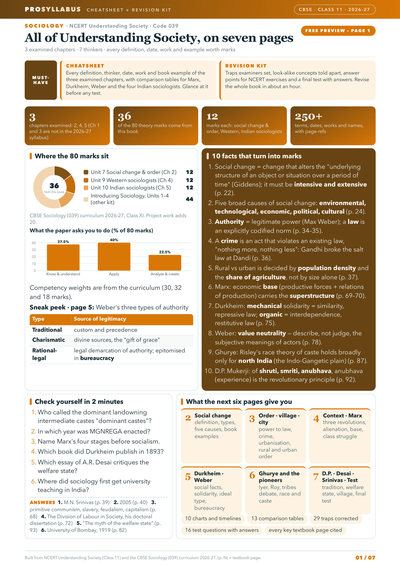 2
2- Sociology
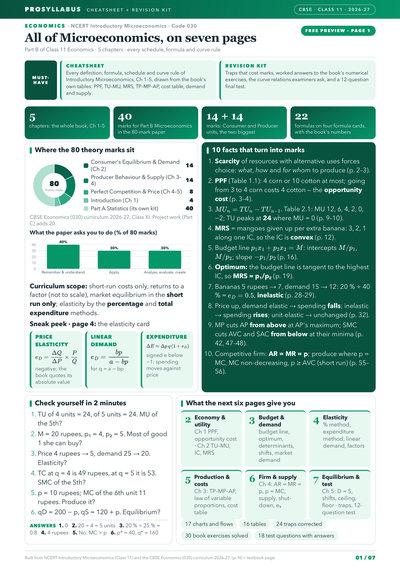
 2
2- Economics
- Physics
- Space weighted by unit marks
- Charts from the book's own data
- Traps corrected
- Space weighted by unit marks
- Charts from the book's own data
- Traps corrected
- Space weighted by unit marks
- Charts from the book's own data
- Traps corrected
- Space weighted by unit marks
- Charts from the book's own data
- Traps corrected
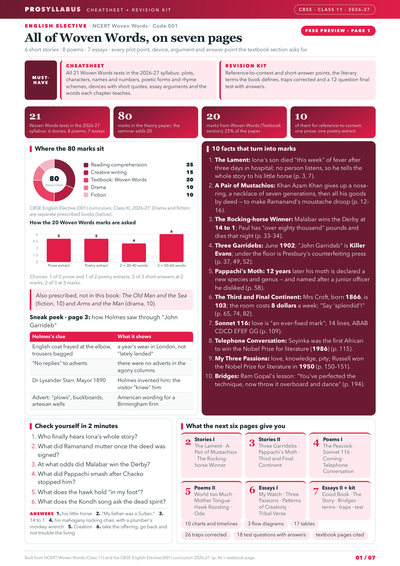
- Space weighted by unit marks
- Charts from the book's own data
- Traps corrected
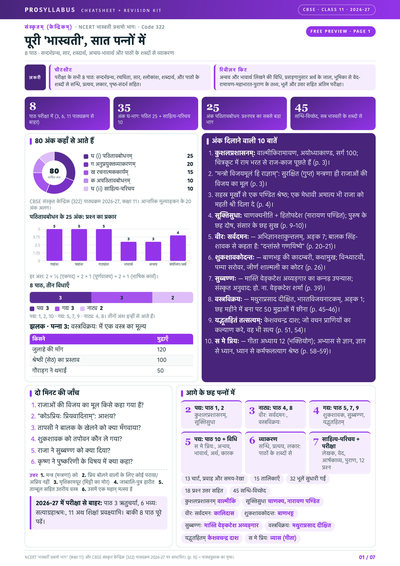
- Space weighted by unit marks
- Charts from the book's own data
- Traps corrected
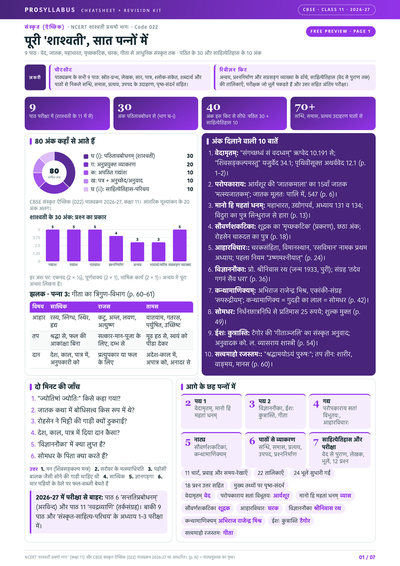
- Space weighted by unit marks
- Charts from the book's own data
- Traps corrected
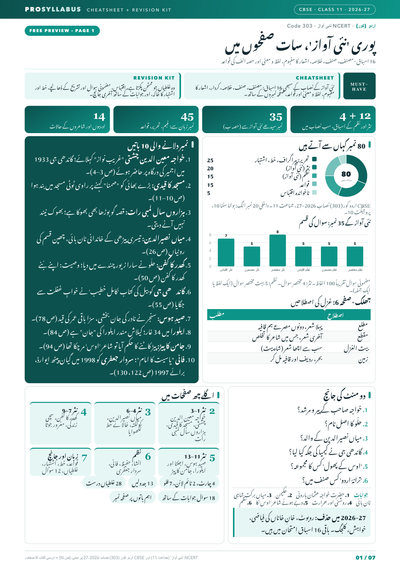
- Space weighted by unit marks
- Charts from the book's own data
- Traps corrected
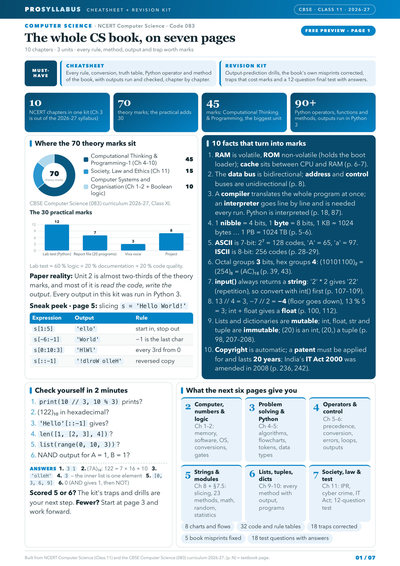
- Space weighted by unit marks
- Charts from the book's own data
- Traps corrected
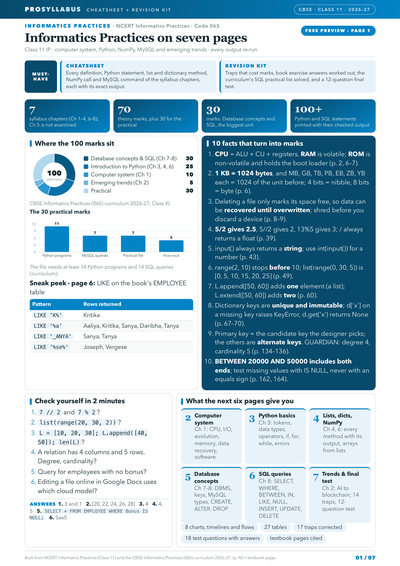
- Space weighted by unit marks
- Charts from the book's own data
- Traps corrected
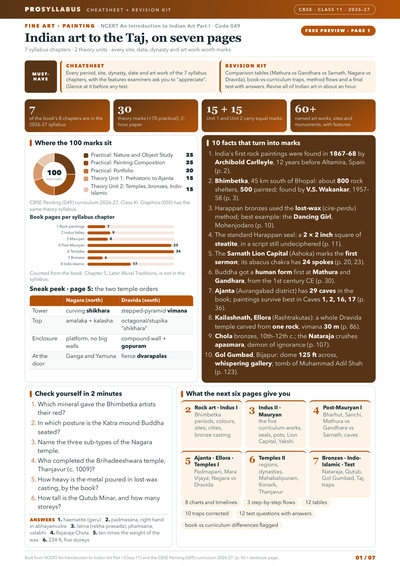
- Space weighted by unit marks
- Charts from the book's own data
- Traps corrected
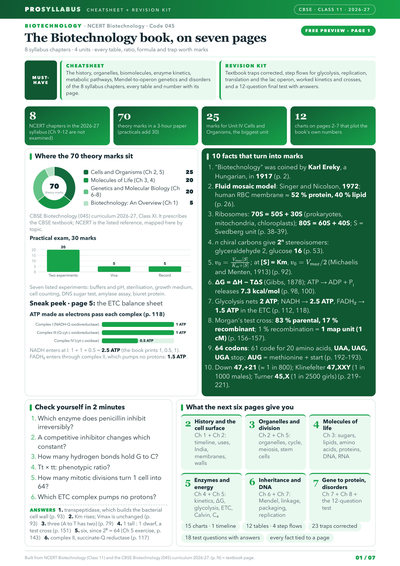
- Space weighted by unit marks
- Charts from the book's own data
- Traps corrected
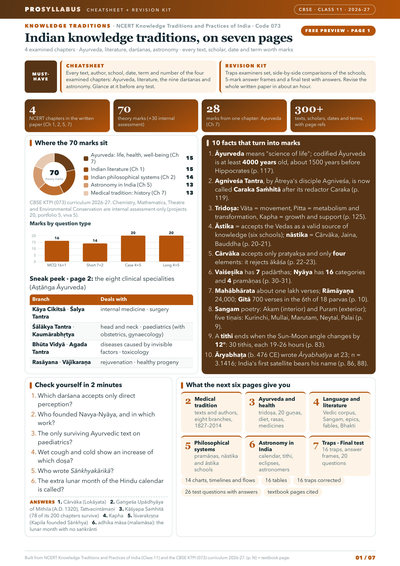
- Space weighted by unit marks
- Charts from the book's own data
- Traps corrected
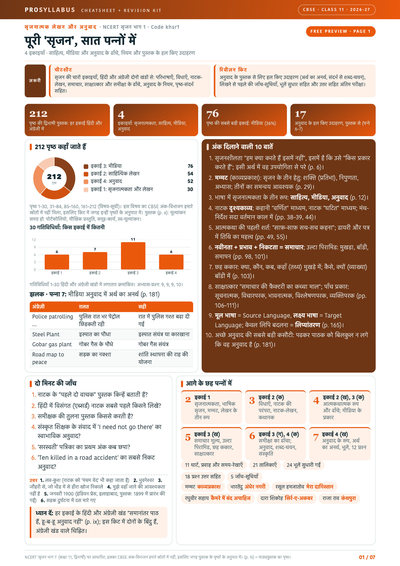
- Space weighted by unit marks
- Charts from the book's own data
- Traps corrected
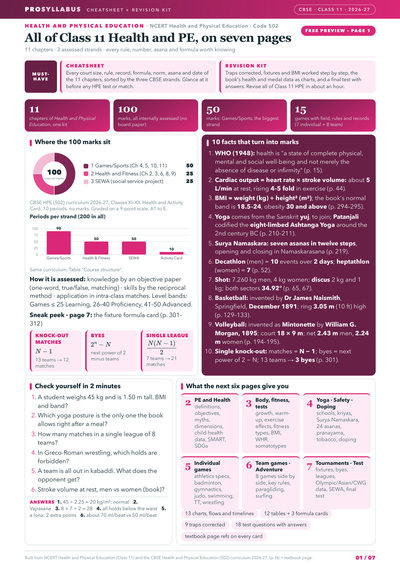
- Space weighted by unit marks
- Charts from the book's own data
- Traps corrected
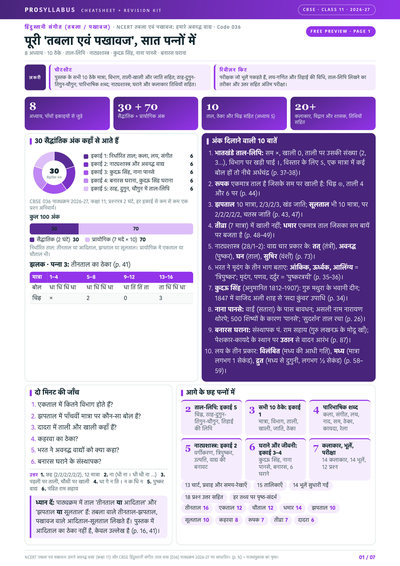
- Space weighted by unit marks
- Charts from the book's own data
- Traps corrected
Chapter summary
Key ideas & terms
- Dispersion
- The scatter or spread of data about a central value.
- Range
- Maximum value minus minimum value of the data.
- Mean deviation
- Average of the absolute deviations from a central value
: . - Variance
- Mean of the squared deviations from the mean:
. - Standard deviation
- The positive square root of the variance,
. - Effect of change
- Adding a constant leaves variance unchanged; multiplying by
multiplies variance by .
Extra questions & answers
Name the measures of dispersion studied.
Range, quartile deviation, mean deviation, variance and standard deviation (this chapter treats all except quartile deviation).
How is the range of a data set found?
Range = Maximum value − Minimum value.
Define mean deviation about the mean for ungrouped data.
Why are deviations squared in computing variance?
Absolute values are hard to handle algebraically; squaring makes all deviations non-negative and allows further algebraic treatment, giving the variance.
Define variance and standard deviation.
Variance
Write the frequency-distribution formula for standard deviation.
What happens to the variance if each observation is increased by a constant?
It remains unchanged, since adding a constant shifts both the data and the mean equally.
If each observation is multiplied by
The new variance is
Find the mean deviation about the mean of
Mean
Why is standard deviation preferred over mean deviation?
Standard deviation uses squared deviations (avoiding absolute values), is amenable to further algebra and is the standard scientific measure of spread.
Name the three measures of central tendency.
The mean, the median and the mode.
Name the methods of finding the mean of grouped data.
The direct method, the assumed-mean (deviation) method and the step-deviation method.
Write the formula for the median of grouped data.
Write the formula for the mode of grouped data.
State the empirical relationship between mean, median and mode.
The mean of 5 numbers is 18. If one number is removed, the mean becomes 16. Find the removed number.
Sum of 5 numbers
What is a cumulative frequency?
The running total of the frequencies up to a given class, used to draw an ogive and to find the median.
What does an ogive help to find?
The median of grouped data graphically, as the x-coordinate of the point where the two cumulative frequency curves meet (or where