Checked 15 October 2026. Official Unit VII syllabus verified 15 October 2026. Paper I timing, marking and barred-item statements below use the NTA December 2026 bulletin dated 8 October; check later official notices for changes. Historical booklet counts are our audit of six pre-NTA booklets and are not a prediction for the next paper.
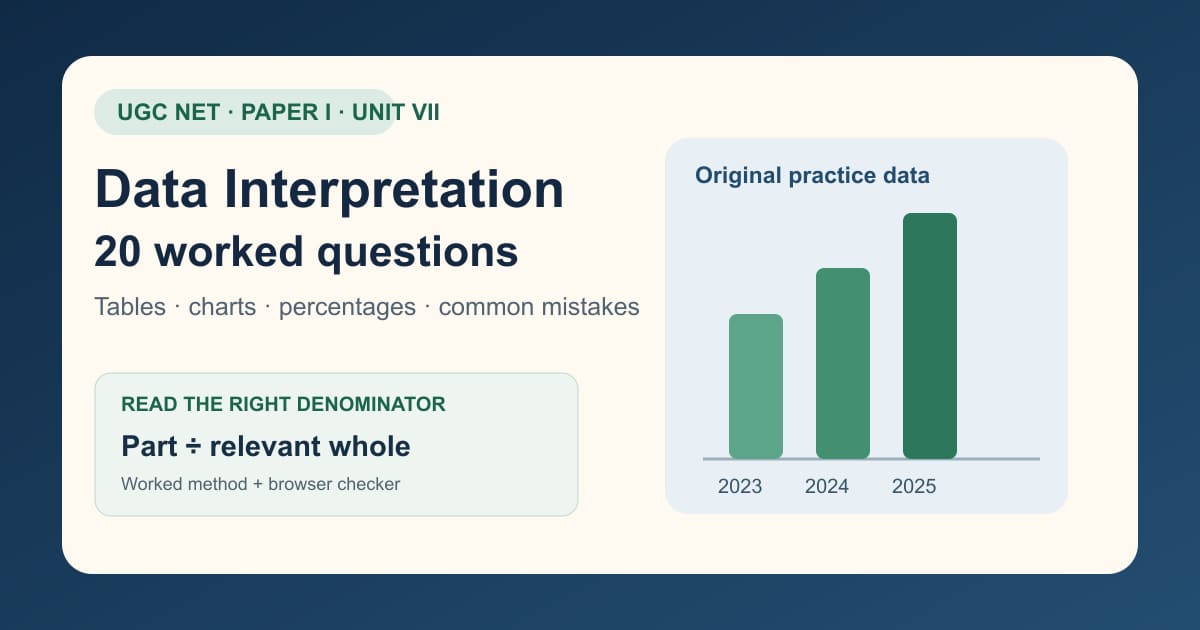
A Data Interpretation set can put five Paper I questions at risk if you read the wrong denominator once. This free workshop shows how to solve 20 original questions from three labelled practice datasets: an admissions table, a course-completion table and a pie-chart budget. Each answer gives the operation and the tempting wrong operation. Start with the official UGC Paper-I syllabus: Unit VII includes data sources and classification, qualitative and quantitative data, bar charts, histograms, pie charts, table charts, line charts, interpretation and data governance. The worked numbers here are invented solely for practice; they describe no real university or budget.
UGC NET Bureau Paper-I syllabus and NTA December 2026 information bulletin; practice-set count is ours.
What is official, what is historical and what is our example
| Statement | Status | What it can tell you |
|---|---|---|
| Unit VII covers sources, data types, charts, interpretation and governance | Official syllabus | The scope to revise; not the exact chart in your paper |
| Five two-mark questions are set from each module | Official syllabus note (i) | Unit VII contributes 10 of Paper I’s 100 marks |
| All six audited UGC Bureau booklets grouped DI questions around one or two datasets | Our count of official 2015–2018 booklets | How those historical booklets were structured; not a 2026 guarantee |
| The numbers, institutions and 20 questions on this page | Our original teaching examples | How to practise operations and detect mistakes; no past-paper frequency |
The NTA December 2026 bulletin lists Paper I as 50 compulsory questions for 100 marks and Paper II as 100 for 200, both inside one 180-minute sitting. It awards two marks for a correct answer and has no negative marking for an incorrect one. It does not give a separate official clock for Unit VII. A fixed “two minutes per DI question” rule is therefore a personal pacing choice, not an instruction from NTA. The December 2026 bulletin is the controlling source for this sitting; check any later NTA notice for a change.
The four operations underneath most table and chart questions
| Prompt language | Operation | Unit of answer | Mistake |
|---|---|---|---|
| How many more? | Later count − earlier count | People, lakh rupees or another original unit | Writing a percent when the question asks for a count |
| What share / rate? | Part ÷ relevant whole × 100 | Percent | Using the grand total when the relevant whole is one department |
| By what percentage did it change? | (New − old) ÷ old × 100 | Percent change | Dividing by the new value |
| How many percentage points? | New percent − old percent | Percentage points | Calling a 2-point gap a 2% growth rate |
Before doing arithmetic, underline both the numerator and the denominator in the question. A university may report “Commerce admitted as a share of all admits,” which means 120 of 745; “Commerce admission rate,” which means 120 of 600; or “Commerce growth in admits,” which means the change from 100 to 120 against the old 100. These are three different questions about the same cell. A correct calculator entry with the wrong whole is still a wrong answer.
Dataset A: applications and admissions
Fictional university example. Each application and admitted figure is a count of people. Admission rate means admitted divided by applications in the same row and year. Read the four departments before the total row; the total is supplied so you can verify your sums.
| Department | 2023 applications | 2023 admitted | 2024 applications | 2024 admitted |
|---|---|---|---|---|
| Arts | 800 | 200 | 1,000 | 250 |
| Science | 600 | 180 | 750 | 225 |
| Commerce | 500 | 100 | 600 | 120 |
| Education | 400 | 120 | 500 | 150 |
| Total | 2,300 | 600 | 2,850 | 745 |
Original illustrative data. The exact counts also appear in the table; bars are not an official admissions statistic.
The bar chart makes one useful point visible: departments differ greatly in applicant counts, so an unweighted average of their admission rates is not the overall university rate. If all four department rates were the same, the shortcut would work; here Arts is 25%, Science and Education are 30%, and Commerce is 20%. The mix of applicants therefore matters. This is a weighted-average problem, even though the word “weighted” may never appear in a test prompt.
1. How many more people applied to Arts in 2024 than in 2023?
Method: 1,000 − 800 = 200
Answer: 200 applications
Watch for: Use applications, not admissions.
2. What was the percentage increase in Arts applications?
Method: (1,000 − 800) ÷ 800 × 100 = 25%
Answer: 25%
Watch for: The denominator is the old value, 800.
3. What was Science’s 2024 admission rate?
Method: 225 ÷ 750 × 100 = 30%
Answer: 30%
Watch for: Applicants are the denominator; do not use the 2024 grand total.
4. Which departments had a 30% admission rate in 2024?
Method: Science: 225 ÷ 750 = 30%; Education: 150 ÷ 500 = 30%.
Answer: Science and Education
Watch for: Equal admitted counts alone do not establish equal rates.
5. How many of the 2024 admits came from Commerce?
Method: 120 ÷ 745 × 100 ≈ 16.11%
Answer: About 16.1%
Watch for: This is a share of all admitted, not Commerce’s own admission rate of 20%.
6. Did the overall admission rate remain exactly unchanged?
Method: 2023: 600 ÷ 2,300 ≈ 26.09%; 2024: 745 ÷ 2,850 ≈ 26.14%.
Answer: No; it rose by about 0.05 percentage points
Watch for: Do not average the four department rates unweighted.
7. What is the increase in total admissions from 2023 to 2024 as a percentage of 2023 admissions?
Method: (745 − 600) ÷ 600 × 100 ≈ 24.17%
Answer: About 24.2%
Watch for: The rise is 145 people; that is not 145%.
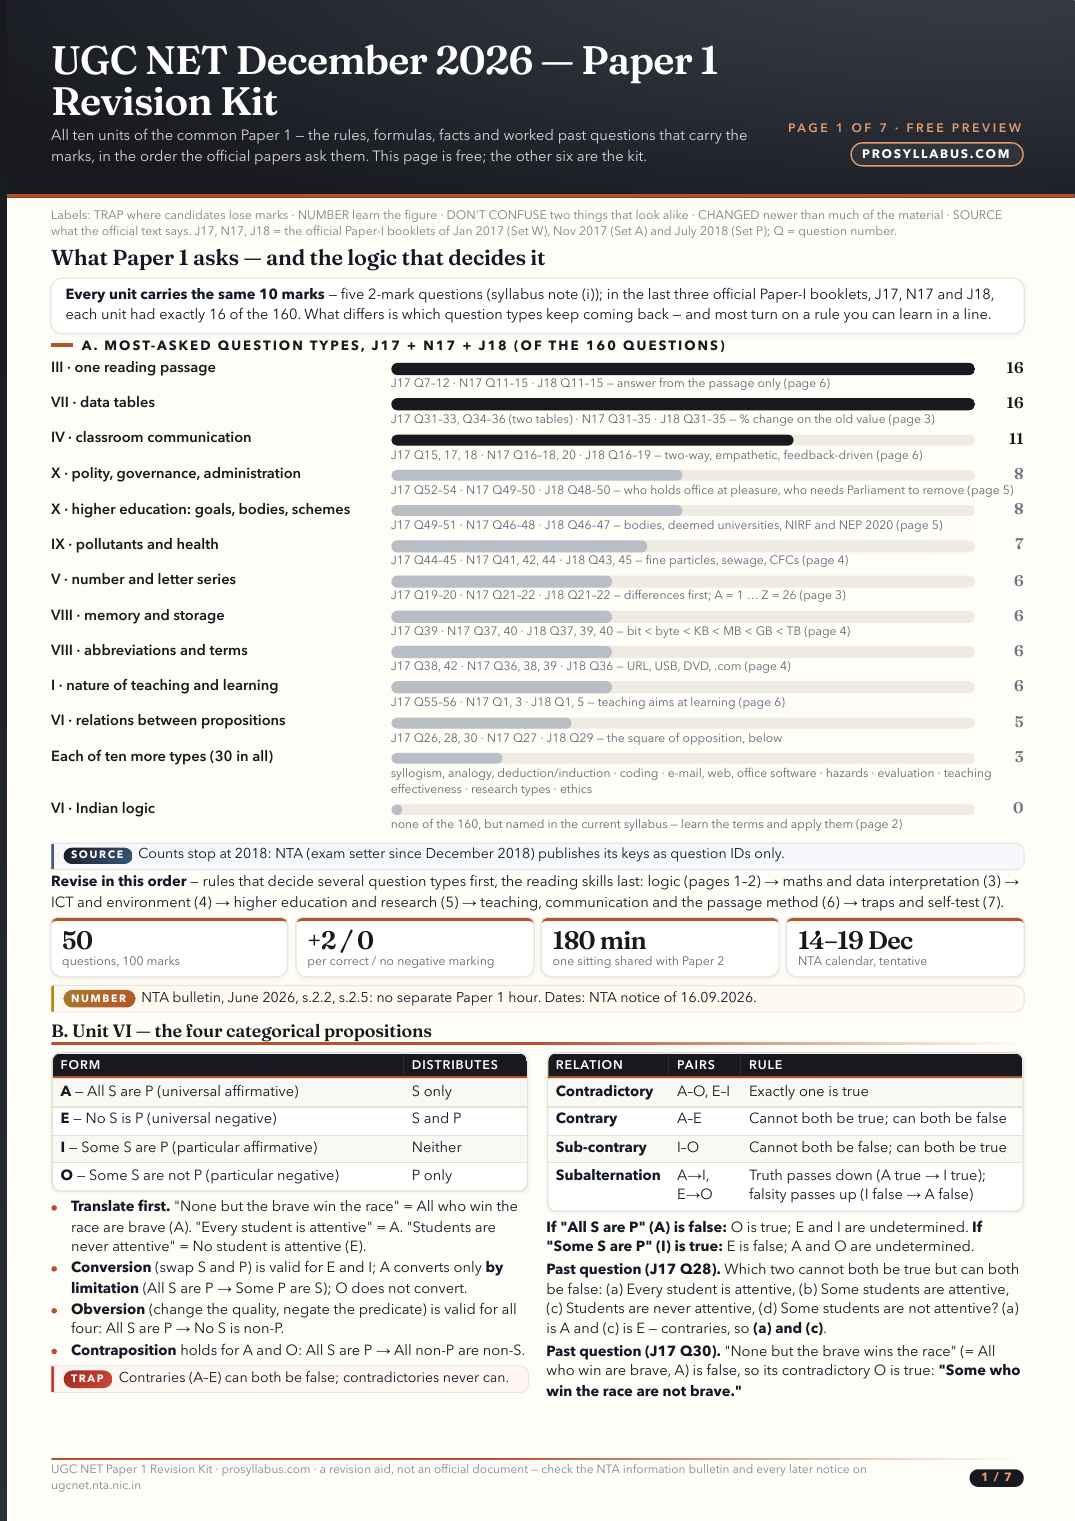
The seven-page UGC NET Paper I revision kit puts the unit rules and formulas into a compact revision aid; its free first page shows the question-type map. This article keeps the complete datasets, explanations and checker free. The kit is a separate digital purchase, so inspect the preview and current price on the offer page before deciding.
Dataset B: course enrollment and completion
Fictional three-course series. Each cell gives “enrolled / completed” for that one course and year; a person is counted only inside the stated year. A completion rate is completed ÷ enrolled for the same row and course. This data deliberately makes Course A’s 2025 rate differ from B and C, so that an average of three percentages cannot replace a pooled calculation.
| Year | Course A enrolled/completed | Course B enrolled/completed | Course C enrolled/completed | All enrolled | All completed |
|---|---|---|---|---|---|
| 2023 | 120 / 72 | 80 / 56 | 100 / 50 | 300 | 178 |
| 2024 | 150 / 90 | 120 / 72 | 100 / 60 | 370 | 222 |
| 2025 | 180 / 117 | 160 / 96 | 120 / 72 | 460 | 285 |
Original illustrative data: 178, 222 and 285. The table is the text fallback for this chart.
8. What was Course B’s completion rate in 2023?
Method: 56 ÷ 80 × 100 = 70%
Answer: 70%
Watch for: Use Course B’s enrolled count in that year.
9. How many more Course A learners completed in 2025 than in 2024?
Method: 117 − 90 = 27
Answer: 27 learners
Watch for: This is a count difference, not a percentage change.
10. What was the combined completion rate of all three courses in 2025?
Method: 285 ÷ 460 × 100 ≈ 61.96%
Answer: About 62.0%
Watch for: Do not average the three course rates without enrollment weights.
11. Which course had the largest increase in completed learners from 2023 to 2025?
Method: A: 117 − 72 = 45; B: 96 − 56 = 40; C: 72 − 50 = 22.
Answer: Course A, by 45 learners
Watch for: Absolute increase differs from percentage increase.
12. By what percentage did total enrollments grow from 2023 to 2025?
Method: (460 − 300) ÷ 300 × 100 ≈ 53.33%
Answer: About 53.3%
Watch for: The 2023 baseline is 300.
13. Can the 2025 overall completion rate be inferred just from Course A’s 65% rate?
Method: No. The other courses had different enrolled counts and 60% rates; combine their actual numerators and denominators.
Answer: No
Watch for: One group’s rate does not determine the pooled rate.
Dataset C: a budget pie chart without the drawing
Imagine a fictional research office dividing a ₹24 lakh budget into the categories below. The table supplies both share and angle so a screen reader, AMP reader or text-only reader can solve every question. A pie chart uses 360° for the whole; one percent is 3.6°. An angle is not money until you multiply the corresponding share by the total budget.
| Budget category | Share | Angle in pie chart | Amount if total is ₹24 lakh |
|---|---|---|---|
| Equipment | 30% | 108° | ₹7.2 lakh |
| Training | 25% | 90° | ₹6.0 lakh |
| Travel | 15% | 54° | ₹3.6 lakh |
| Books | 10% | 36° | ₹2.4 lakh |
| Data | 20% | 72° | ₹4.8 lakh |
| Total | 100% | 360° | ₹24.0 lakh |
Percentages sum to 100; rupee values and angles are in the adjacent table.
14. How much of the ₹24 lakh budget is for travel?
Method: 15% × ₹24 lakh = ₹3.6 lakh
Answer: ₹3.6 lakh
Watch for: A 15% slice is 54°, not ₹54 lakh.
15. What central angle represents equipment?
Method: 30% × 360° = 108°
Answer: 108°
Watch for: Multiply by 360°, not 180°.
16. How much more goes to equipment than books?
Method: (30% − 10%) × ₹24 lakh = 20% × ₹24 lakh = ₹4.8 lakh
Answer: ₹4.8 lakh
Watch for: The gap is 20 percentage points of the total, not a 20% increase over books.
17. What fraction of the whole goes to training plus data?
Method: 25% + 20% = 45% = 9/20
Answer: 9/20
Watch for: Both categories share the same whole, so their percentages can be added.
18. If the total becomes ₹30 lakh and the shares stay fixed, what is the new equipment amount?
Method: 30% × ₹30 lakh = ₹9 lakh
Answer: ₹9 lakh
Watch for: The rupee amount changes even when the percentage is constant.
19. If equipment rises from ₹7.2 lakh to ₹9 lakh, what is its relative percentage increase?
Method: (9 − 7.2) ÷ 7.2 × 100 = 25%
Answer: 25%
Watch for: This uses the old equipment amount as baseline, not the whole budget.
20. Does training’s 25% slice mean it receives 25 percentage points more than books?
Method: 25% − 10% = 15 percentage points.
Answer: No; the difference is 15 percentage points
Watch for: A percentage-point gap compares shares, not rupee growth.
Use the share checker on any two rows or years
The checker below accepts part and whole in two periods. It calculates each share, their percentage-point difference and relative growth in the part count. For the default Commerce-admitted example, the part count grows 20% (100 to 120) while its share among all admitted people falls from 16.67% to 16.11%, about 0.56 percentage points. Growth in a count and change in its share can point in opposite directions when the whole grows faster.
| Example | Earlier share | Later share | Share change | Part-count change |
|---|---|---|---|---|
| Commerce admits / all admits, 2023 → 2024 | 100/600 = 16.67% | 120/745 ≈ 16.11% | −0.56 percentage points | +20% |
| Science admitted / Science applicants, 2023 → 2024 | 180/600 = 30% | 225/750 = 30% | 0 percentage points | +25% |
A six-step routine for unseen DI sets
| Step | What to do | Why |
|---|---|---|
| 1. Name the units | Check whether entries are people, thousands, lakhs, percentages or degrees. | A correct division with incompatible units is meaningless. |
| 2. Read the title and footnotes | Identify the population and year. Note “per 100,” “in lakhs,” and any exclusion. | The title supplies the denominator that a rushed reader may invent. |
| 3. Mark row and column | For every question, point to the exact row and column before calculating. | A nearby total can be a plausible but wrong whole. |
| 4. Write the operation | Count gap, share, relative growth or percentage-point gap. | Do not choose an operation from the appearance of the answer options. |
| 5. Estimate first | Check rough size, direction and whether a rate can exceed 100%. | This catches digit and denominator errors quickly. |
| 6. Audit one answer | Multiply the result back or compare with the original table. | An audit is more valuable than repeating the same mistaken calculation. |
When a set is slow, identify the bottleneck rather than saying only “DI is weak.” An error log can distinguish misread axes, wrong denominator, arithmetic slip, poor estimate and time spent transcribing numbers. Repair one type at a time. The next practice set should use different surface data: a line chart if you practised a table, or two subgroup rates if you practised a pie chart. Repeating the same twenty numbers until you remember their answers will give false confidence.
What the old official booklets can and cannot tell us
Our published Paper I booklet audit classified 340 questions in six official UGC NET Bureau booklets, one set each from June 2015 through July 2018. It found 34 Unit VII questions across the six sets. In the June 2015, December 2015, July 2016 and January 2017 sets, there were six DI questions in each; the November 2017 and July 2018 sets had five each. Every set used one or two shared data displays rather than six unrelated stand-alone numericals. These are auditable historical observations, not a claim about the current NTA computer-based paper. The UGC syllabus note is the current basis for five two-mark questions per module.
| Official booklet we audited | Unit VII positions | Number in this booklet |
|---|---|---|
| June 2015, Set A | Q37–42 | 6 |
| December 2015, Set P | Q37–42 | 6 |
| July 2016, Set A | Q35–40 | 6 |
| January 2017, Set W | Q31–36 | 6 |
| November 2017, Set A | Q31–35 | 5 |
| July 2018, Set P | Q31–35 | 5 |
The complete Paper I syllabus and booklet-count audit explains the 340-row method and links every booklet. For the papers and keys NTA actually makes public, use our official-paper access guide. Current-cycle questions shown briefly inside a candidate login should not be relabelled as an openly downloadable official PDF.
Questions candidates ask
Frequently asked questions
How many UGC NET Paper I Data Interpretation questions are there?
The official Paper I syllabus note says five questions carrying two marks each are set from every module, including Unit VII. The historical UGC Bureau booklets we audited had five or six Unit VII questions each because their older paper format differed.
Is there a separate time limit for Data Interpretation?
The December 2026 NTA bulletin gives one 180-minute sitting for Paper I and Paper II together and no official Unit VII clock. Use timed practice to find a personal pace.
Are the twenty questions on this page previous-year questions?
No. All three datasets and twenty worked questions are original practice examples. The separately linked six-booklet audit identifies actual official booklet positions.
What is the difference between a percent change and percentage points?
Percent change divides the count difference by the old count. Percentage points subtracts two percentages. A share moving from 20% to 25% rises five percentage points and 25% relative to its old share.
Can I use a calculator in the exam?
No. The December 2026 NTA bulletin explicitly bars calculators from the examination hall (section 8.11 and the barred-items list). The browser checker here is for learning at home; solve examples by hand first.
Does the kit include this entire workshop?
The separate seven-page Paper I revision kit condenses formulas, rules and question-type observations across all ten units. The full twenty-question workshop on this page is free and remains available here.
The free first page of the revision kit lets you judge whether its compact format helps your final review; the kit page has the current price. ProSyllabus is an independent study site, not part of UGC or NTA. For cycle-specific rules, rely on the conducting body’s current notice.
More in this series
- UGC NET cut-offs by subject and category, every cycle since 2023
- UGC NET JRF vs Assistant Professor vs PhD only
- UGC NET pattern, marking, percentile and normalised marks
- UGC NET previous papers and official answer keys
- UGC NET December 2026 dates and every past cycle's timeline
- Teaching Aptitude: worked classroom decisions
- Research Aptitude: methods and ethics cases
- UGC NET Paper 1 syllabus unit-wise, with weightage counted
- UGC NET notice board — alerts and updates
- UGC NET exam day: time management and CBT
- UGC NET syllabus and a study plan
- CSIR NET: JRF vs Assistant Professor
Sources
- official — UGC NET Bureau: official Paper I syllabus, Unit VII and note (i)
- official — NTA: UGC-NET December 2026 information bulletin dated 8 October, sections 3.2–3.5 and 8.11
- official — UGC NET Bureau: previous question-paper archive (official 2015–2018 booklets)
- reported — UGC NET Paper I: our six-booklet question-level audit and sources
official = a document published by the conducting body. reported = a news or coaching site we could not check against an original. Where sources disagree this page says so rather than picking one.