Class 10 › Mathematics Statistics Class 10 Mathematics · Chapter 13
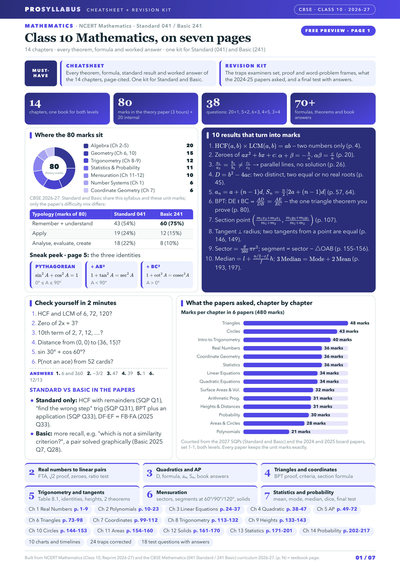
Practice all → Summary Questions & answers Practise this chapter → Download revision card Share on WhatsApp CBSE Class 10 Board Examination communityView all SummaryStatistics deals with collecting, organising and interpreting numerical data. This chapter focuses on measures of central tendency for grouped data — the mean (using the direct, assumed-mean or step-deviation method), the median (using the median class and its formula) and the mode (using the modal class formula). It also explains the relationship \(\text{Mode} = 3\,\text{Median} - 2\,\text{Mean}\). These measures summarise a large data set with a single representative value, which is essential for comparing and drawing conclusions from data.
Mean of grouped data Median of grouped data Mode of grouped data Relationship between mean, median and mode Key termsMean
The average value of the data.
Median
The middle value that divides ordered data into two halves.
Mode
The most frequently occurring value (or modal class).
Empirical relationship
\(\text{Mode} = 3\,\text{Median} - 2\,\text{Mean}\).
Extra questions & answersQ1 State the empirical relationship between mean, median and mode. Answer Q2 Name three methods to find the mean of grouped data. Answer Q3 Name the three measures of central tendency. Answer Q4 Name the methods of finding the mean of grouped data. Answer Q5 Write the formula for the median of grouped data. Answer Q6 Write the formula for the mode of grouped data. Answer Q7 State the empirical relationship between mean, median and mode. Answer Q8 The mean of 5 numbers is 18. If one number is removed, the mean becomes 16. Find the removed number. Answer Q9 What is a cumulative frequency? Answer Q10 What does an ogive help to find? Answer Activity 1 :Q1 From the Table 13.3 find the mean by taking each of \(x_i\) (i.e., \(17.5, 32.5,\) and so on) as ‘\(a\)’. What do you observe? You will find that the mean determined in each case is the same, i.e., \(62\). (Why ?) Answer Activity 2 :Q1 1. Collect the marks obtained by all the students of your class in Mathematics in the latest examination conducted by your school. Form a grouped frequency distribution of the data obtained. Answer Q2 2. Collect the daily maximum temperatures recorded for a period of \(30\) days in your city. Present this data as a grouped frequency table. Answer Q3 3. Measure the heights of all the students of your class (in cm) and form a grouped frequency distribution table of this data. Answer EXERCISE 13.1Q1 1. A survey was conducted by a group of students as a part of their environment awareness programme, in which they collected the following data regarding the number of plants in \(20\) houses in a locality. Find the mean number of plants per house. Number of plants: \(0-2, 2-4, 4-6, 6-8, 8-10, 10-12, 12-14\). Number of houses: \(1,2,1,5,6,2,3\). Which method did you use for finding the mean, and why? Answer Q2 2. Consider the following distribution of daily wages of \(50\) workers of a factory. Daily wages (in ₹): \(500-520, 520-540, 540-560, 560-580, 580-600\). Number of workers: \(12,14,8,6,10\). Find the mean daily wages of the workers of the factory by using an appropriate method. Answer Q3 3. The following distribution shows the daily pocket allowance of children of a locality. The mean pocket allowance is ₹\(18\). Find the missing frequency \(f\). Daily pocket allowance (in ₹): \(11-13, 13-15, 15-17, 17-19, 19-21, 21-23, 23-25\). Number of children: \(7,6,9,13,f,5,4\). Answer Q4 4. Thirty women were examined in a hospital by a doctor and the number of heartbeats per minute were recorded and summarised as follows. Find the mean heartbeats per minute for these women, choosing a suitable method. Number of heartbeats per minute: \(65-68, 68-71, 71-74, 74-77, 77-80, 80-83, 83-86\). Number of women: \(2,4,3,8,7,4,2\). Answer Q5 5. In a retail market, fruit vendors were selling mangoes kept in packing boxes. These boxes contained varying number of mangoes. The following was the distribution of mangoes according to the number of boxes. Number of mangoes: \(50-52, 53-55, 56-58, 59-61, 62-64\). Number of boxes: \(15,110,135,115,25\). Find the mean number of mangoes kept in a packing box. Which method of finding the mean did you choose? Answer Q6 6. The table below shows the daily expenditure on food of \(25\) households in a locality. Daily expenditure (in ₹): \(100-150, 150-200, 200-250, 250-300, 300-350\). Number of households: \(4,5,12,2,2\). Find the mean daily expenditure on food by a suitable method. Answer Q7 7. To find out the concentration of \(SO_2\) in the air (in parts per million, i.e., ppm), the data was collected for \(30\) localities in a certain city and is presented below: Concentration of \(SO_2\) (in ppm): \(0.00-0.04, 0.04-0.08, 0.08-0.12, 0.12-0.16, 0.16-0.20, 0.20-0.24\). Frequency: \(4,9,9,2,4,2\). Find the mean concentration of \(SO_2\) in the air. Answer Q8 8. A class teacher has the following absentee record of \(40\) students of a class for the whole term. Find the mean number of days a student was absent. Number of days: \(0-6, 6-10, 10-14, 14-20, 20-28, 28-38, 38-40\). Number of students: \(11,10,7,4,4,3,1\). Answer Q9 9. The following table gives the literacy rate (in percentage) of \(35\) cities. Find the mean literacy rate. Literacy rate (in %): \(45-55, 55-65, 65-75, 75-85, 85-95\). Number of cities: \(3,10,11,8,3\). Answer Activity 3 :Q1 Continuing with the same groups as formed in Activity 2 and the situations assigned to the groups. Ask each group to find the mode of the data. They should also compare this with the mean, and interpret the meaning of both. Answer EXERCISE 13.2Q1 1. The following table shows the ages of the patients admitted in a hospital during a year: Age (in years): \(5-15, 15-25, 25-35, 35-45, 45-55, 55-65\). Number of patients: \(6,11,21,23,14,5\). Find the mode and the mean of the data given above. Compare and interpret the two measures of central tendency. Answer Q2 2. The following data gives the information on the observed lifetimes (in hours) of \(225\) electrical components: Lifetimes (in hours): \(0-20, 20-40, 40-60, 60-80, 80-100, 100-120\). Frequency: \(10,35,52,61,38,29\). Determine the modal lifetimes of the components. Answer Q3 3. The following data gives the distribution of total monthly household expenditure of \(200\) families of a village. Find the modal monthly expenditure of the families. Also, find the mean monthly expenditure: Expenditure (in ₹): \(1000-1500, 1500-2000, 2000-2500, 2500-3000, 3000-3500, 3500-4000, 4000-4500, 4500-5000\). Number of families: \(24,40,33,28,30,22,16,7\). Answer Q4 4. The following distribution gives the state-wise teacher-student ratio in higher secondary schools of India. Find the mode and mean of this data. Interpret the two measures. Number of students per teacher: \(15-20, 20-25, 25-30, 30-35, 35-40, 40-45, 45-50, 50-55\). Number of states / U.T.: \(3,8,9,10,3,0,0,2\). Answer Q5 5. The given distribution shows the number of runs scored by some top batsmen of the world in one-day international cricket matches. Runs scored: \(3000-4000, 4000-5000, 5000-6000, 6000-7000, 7000-8000, 8000-9000, 9000-10000, 10000-11000\). Number of batsmen: \(4,18,9,7,6,3,1,1\). Find the mode of the data. Answer Q6 6. A student noted the number of cars passing through a spot on a road for \(100\) periods each of \(3\) minutes and summarised it in the table given below. Find the mode of the data: Number of cars: \(0-10, 10-20, 20-30, 30-40, 40-50, 50-60, 60-70, 70-80\). Frequency: \(7,14,13,12,20,11,15,8\). Answer EXERCISE 13.3Q1 1. The following frequency distribution gives the monthly consumption of electricity of \(68\) consumers of a locality. Find the median, mean and mode of the data and compare them. Monthly consumption (in units): \(65-85, 85-105, 105-125, 125-145, 145-165, 165-185, 185-205\). Number of consumers: \(4,5,13,20,14,8,4\). Answer Q2 2. If the median of the distribution given below is \(28.5\), find the values of \(x\) and \(y\). Class interval: \(0-10, 10-20, 20-30, 30-40, 40-50, 50-60\). Frequency: \(5,x,20,15,y,5\). Total: \(60\). Answer Q3 3. A life insurance agent found the following data for distribution of ages of \(100\) policy holders. Calculate the median age, if policies are given only to persons having age \(18\) years onwards but less than \(60\) year. Age (in years): Below \(20\), Below \(25\), Below \(30\), Below \(35\), Below \(40\), Below \(45\), Below \(50\), Below \(55\), Below \(60\). Number of policy holders: \(2,6,24,45,78,89,92,98,100\). Answer Q4 4. The lengths of \(40\) leaves of a plant are measured correct to the nearest millimetre, and the data obtained is represented in the following table: Length (in mm): \(118-126, 127-135, 136-144, 145-153, 154-162, 163-171, 172-180\). Number of leaves: \(3,5,9,12,5,4,2\). Find the median length of the leaves. (Hint : The data needs to be converted to continuous classes for finding the median, since the formula assumes continuous classes. The classes then change to \(117.5-126.5, 126.5-135.5, . . ., 171.5-180.5\).) Answer Q5 5. The following table gives the distribution of the life time of \(400\) neon lamps: Life time (in hours): \(1500-2000, 2000-2500, 2500-3000, 3000-3500, 3500-4000, 4000-4500, 4500-5000\). Number of lamps: \(14,56,60,86,74,62,48\). Find the median life time of a lamp. Answer Q6 6. \(100\) surnames were randomly picked up from a local telephone directory and the frequency distribution of the number of letters in the English alphabets in the surnames was obtained as follows: Number of letters: \(1-4, 4-7, 7-10, 10-13, 13-16, 16-19\). Number of surnames: \(6,30,40,16,4,4\). Determine the median number of letters in the surnames. Find the mean number of letters in the surnames? Also, find the modal size of the surnames. Answer Q7 7. The distribution below gives the weights of \(30\) students of a class. Find the median weight of the students. Weight (in kg): \(40-45, 45-50, 50-55, 55-60, 60-65, 65-70, 70-75\). Number of students: \(2,3,8,6,6,3,2\). Answer Try one from this chapter
The most frequently occurring value in a data set is the:
A range B mode C mean D median
Flashcards & interactive practice