Tales by Dots and Lines — Class 8 Mathematics
Ganita Prakash Part 2 · Chapter 6
CBSE Class 8 community
View allMathematics
 2
2~140days leftAnnual exams · school dates varyFeb–Mar 2027 · school-specific · tentative
All 2 books, one purchase- Mathematics
All available subjects
~140days leftAnnual exams · school dates varyFeb–Mar 2027 · school-specific · tentative
Every subject, one purchase- Mathematics
- Science
- + 3 more
Science
~140days leftAnnual exams · school dates varyFeb–Mar 2027 · school-specific · tentative
TrendingEvery important point, highly compressed.- Space weighted by chapter size
- Charts from the book's own data
- Traps corrected
हिंदी
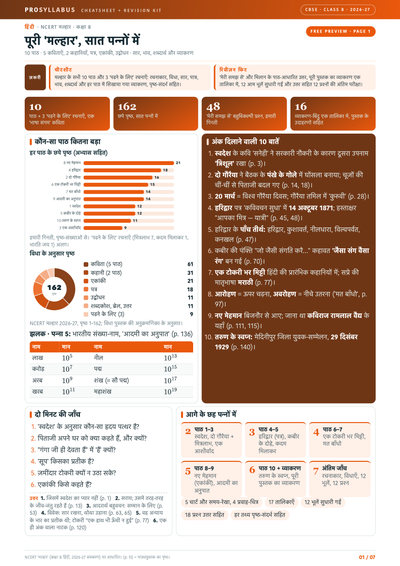
~140days leftAnnual exams · school dates varyFeb–Mar 2027 · school-specific · tentative
Every important point, highly compressed.- Space weighted by chapter size
- Charts from the book's own data
- Traps corrected
Social Science
~140days leftAnnual exams · school dates varyFeb–Mar 2027 · school-specific · tentative
TrendingEvery important point, highly compressed.- Space weighted by chapter size
- Charts from the book's own data
- Traps corrected
English · Poorvi
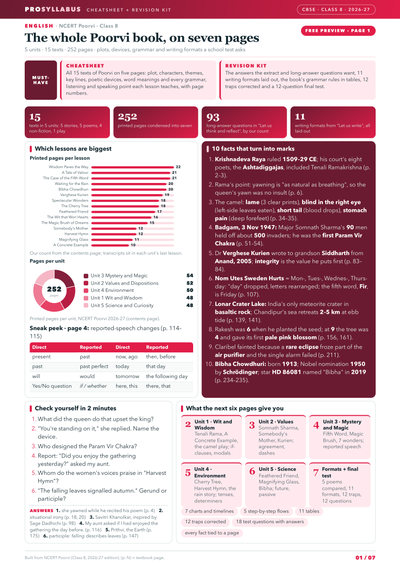
~140days leftAnnual exams · school dates varyFeb–Mar 2027 · school-specific · tentative
Every important point, highly compressed.- Space weighted by chapter size
- Charts from the book's own data
- Traps corrected
Chapter summary
This data-handling chapter deepens the ideas of mean and median and introduces line graphs. The mean is reinterpreted as a balance point: the total distance of values to its left equals the total distance to its right, and there is only one such centre. Including a value above the mean raises it, and below it lowers it; the same logic governs the median, the middle value of sorted data. Algebra shows that adding a fixed number
Mean as a balance pointMedian and changing dataMean and median with frequenciesSpreadsheetsLine graphs and interpreting data
Key ideas & terms
- Mean
- The sum of all values divided by their count; a balance point where total left and right distances are equal.
- Median
- The middle value of data arranged in order, with equally many values above and below it.
- Balance point
- The interpretation of the mean as the unique value equalising distances on both sides.
- Frequency table
- A table listing each value with how often it occurs, used to find mean and median efficiently.
- Spreadsheet
- A grid of cells where formulas like
and compute totals and averages. - Line graph
- A graph of points joined by line segments, used to show change over time.
Extra questions & answers
How is the mean a balance point?
The total distance from the mean to values below it equals the total distance to values above it.
What happens to the mean when a value greater than it is added?
The mean increases, to keep the left and right distances balanced.
If every value increases by
The mean also increases by
If every value is doubled, what happens to the mean?
The mean is doubled as well.
How do you find the median of data given in a frequency table?
Add frequencies in order until you reach the middle position(s); that value is the median.
What spreadsheet formula finds the total of cells B3 to G3?
What does a line graph show best?
How a quantity changes over time, by connecting data points with line segments.
Including a value less than the median does what to the median?
It decreases the median.
How do you judge the rate of change on a line graph?
By the steepness of the segments — steeper lines mean faster change.
What are the two steps for reading a graph?
First identify what is given (scale, axes, marks); then infer and interpret the trends.