Introduction — Class 11 Economics
Statistics for Economics · Chapter 1Trending
CBSE Class 11 community
View all
 2
2- Economics
 7
7- Mathematics
- Physics
- + 3 more
- Physics
- Chemistry
- + 3 more
 7
7- Accountancy
- Business Studies
- + 3 more
- Accountancy
 2
2- हिंदी
 2
2- हिंदी
 2
2- Chemistry
 2
2- Political Science
 2
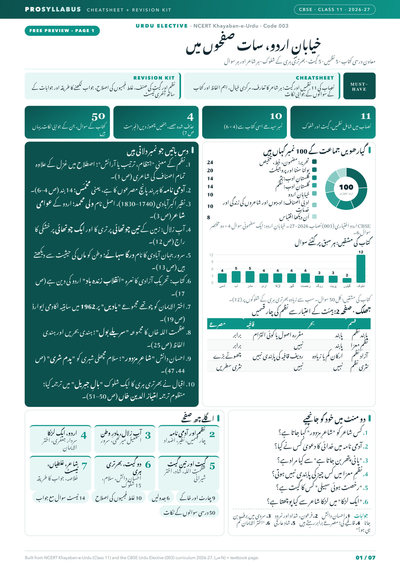
2- اردو
- Urdu Elective
 2
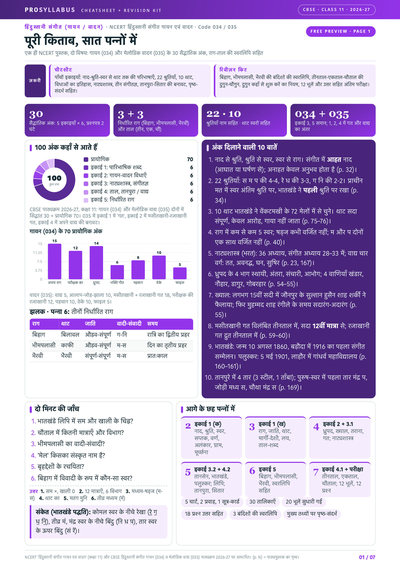
2- हिंदुस्तानी संगीत
 2
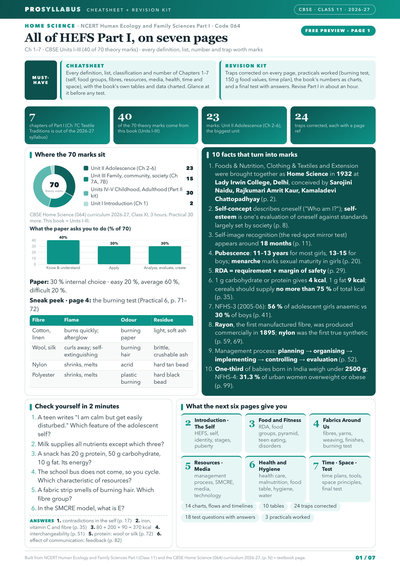
2- Home Science
 2
2- Hornbill
- Snapshots
 3
3- Geography
 2
2- Sociology
- Physics
- Space weighted by unit marks
- Charts from the book's own data
- Traps corrected
- Space weighted by unit marks
- Charts from the book's own data
- Traps corrected
- Space weighted by unit marks
- Charts from the book's own data
- Traps corrected
- Space weighted by unit marks
- Charts from the book's own data
- Traps corrected
- Space weighted by unit marks
- Charts from the book's own data
- Traps corrected
- Space weighted by unit marks
- Charts from the book's own data
- Traps corrected
- Space weighted by unit marks
- Charts from the book's own data
- Traps corrected
- Space weighted by unit marks
- Charts from the book's own data
- Traps corrected
- Space weighted by unit marks
- Charts from the book's own data
- Traps corrected
- Space weighted by unit marks
- Charts from the book's own data
- Traps corrected
- Space weighted by unit marks
- Charts from the book's own data
- Traps corrected
- Space weighted by unit marks
- Charts from the book's own data
- Traps corrected
- Space weighted by unit marks
- Charts from the book's own data
- Traps corrected
- Space weighted by unit marks
- Charts from the book's own data
- Traps corrected
- Space weighted by unit marks
- Charts from the book's own data
- Traps corrected
- Space weighted by unit marks
- Charts from the book's own data
- Traps corrected
- Space weighted by unit marks
- Charts from the book's own data
- Traps corrected
Chapter summary
Key ideas & terms
- Scarcity
- The condition where wants exceed the resources available to satisfy them, forcing choice; the root of all economic problems.
- Economic activity
- Any activity undertaken for a monetary gain, such as consumption, production or employment.
- Economic data
- Economic facts expressed in the form of numbers, used to analyse problems and frame policies.
- Statistics
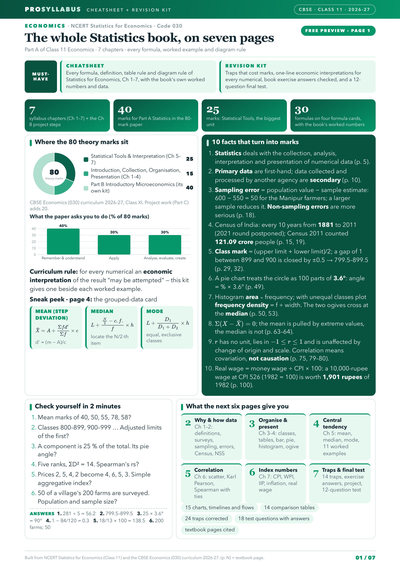
- The study of the collection, organisation, presentation, analysis and interpretation of numerical data.
- Quantitative data
- Information that can be measured and expressed numerically, such as income, marks or output.
- Qualitative data
- Information describing an attribute that cannot be measured numerically, such as gender, honesty or literacy.
Extra questions & answers
Why is scarcity called the root of all economic problems?
Because wants are unlimited while resources are limited and have alternative uses, every person and society must choose, and this problem of choice underlies all economic problems.
Who is called a consumer, a producer and an employee?
A consumer buys goods to satisfy needs, a producer makes goods or provides services, and an employee works for another person in return for wages or a salary.
What are the three conventional divisions of the study of economics?
Economics is studied as consumption (how a consumer spends), production (what and how a producer makes) and distribution (how national income is divided into wages, profits, rents and interest).
What is meant by economic data?
Economic facts expressed in terms of numbers, such as the rise of rice production in India from 39.58 to 106.5 million tonnes, which can be collected and analysed.
Define statistics as used in economics.
Statistics deals with the collection, organisation, presentation, analysis and interpretation of numerical data relating to economic facts.
Distinguish between quantitative and qualitative data with examples.
Quantitative data are measurable, like income or production in tonnes; qualitative data describe an attribute that cannot be measured, like gender, literacy or beauty.
How does statistics help condense data?
It reduces a large mass of figures into a few summary measures such as the mean, variance or standard deviation, which are easy to remember and compare.
How does statistics help in finding relationships between economic factors?
By applying statistical methods to data, an economist can verify whether a relationship exists, for example between price and demand, and test assumptions about it.
How does statistics aid prediction and policy?
It helps forecast future trends such as expected consumption or oil demand, which planners use to decide production targets and frame appropriate policies.
Why are statistical methods no substitute for common sense?
Statistical results can be misused, as in the story of the family that drowned in a river whose average depth was less than their average height; averages must be interpreted sensibly.