Correlation — Class 11 Economics
Statistics for Economics · Chapter 6
CBSE Class 11 community
View all
 2
2- Economics
 7
7- Mathematics
- Physics
- + 3 more
- Physics
- Chemistry
- + 3 more
 7
7- Accountancy
- Business Studies
- + 3 more
- Accountancy
 2
2- हिंदी
 2
2- हिंदी
 2
2- Chemistry
 2
2- Political Science
 2
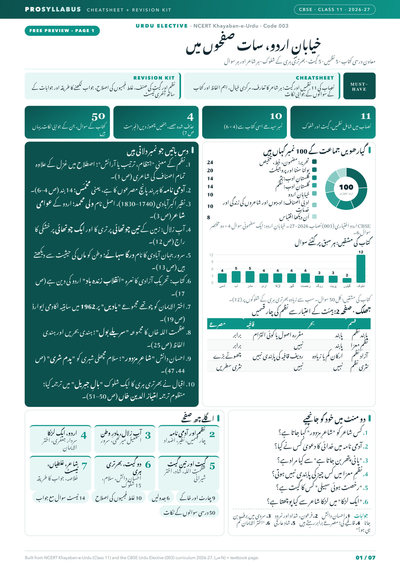
2- اردو
- Urdu Elective
 2
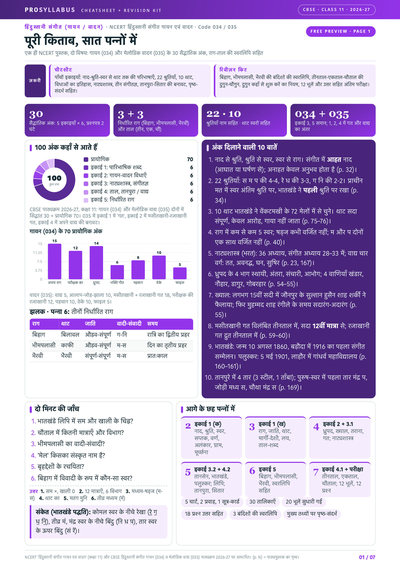
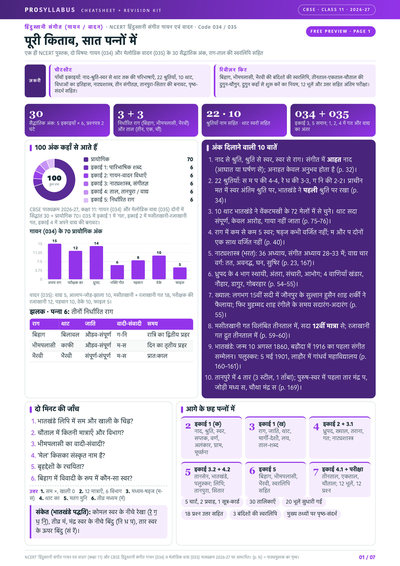
2- हिंदुस्तानी संगीत
 2
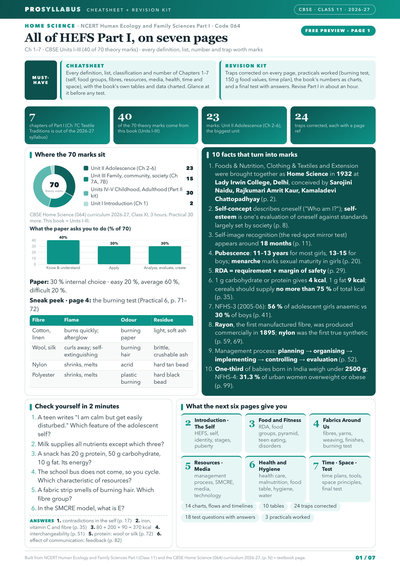
2- Home Science
 2
2- Hornbill
- Snapshots
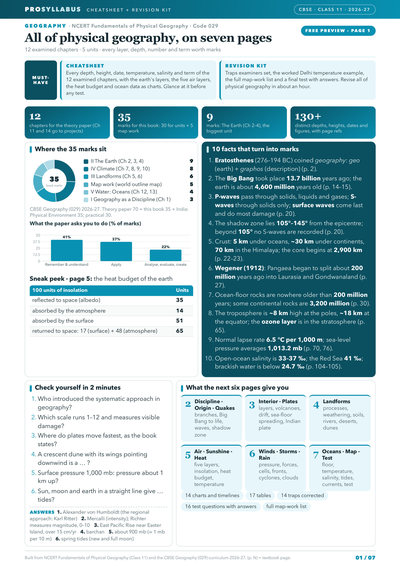
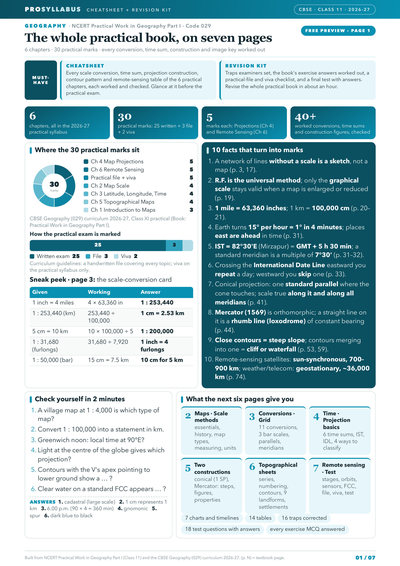 3
3- Geography
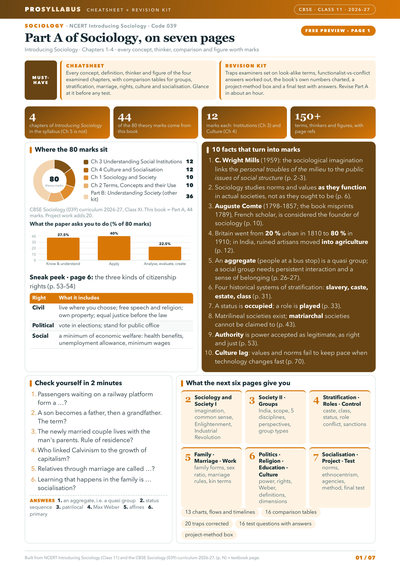
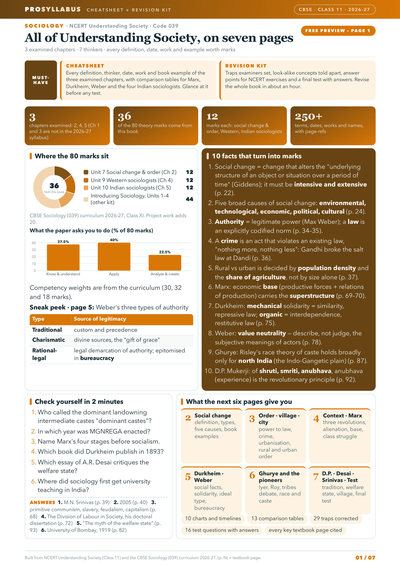 2
2- Sociology
- Physics
- Space weighted by unit marks
- Charts from the book's own data
- Traps corrected
- Space weighted by unit marks
- Charts from the book's own data
- Traps corrected
- Space weighted by unit marks
- Charts from the book's own data
- Traps corrected
- Space weighted by unit marks
- Charts from the book's own data
- Traps corrected
- Space weighted by unit marks
- Charts from the book's own data
- Traps corrected
- Space weighted by unit marks
- Charts from the book's own data
- Traps corrected
- Space weighted by unit marks
- Charts from the book's own data
- Traps corrected
- Space weighted by unit marks
- Charts from the book's own data
- Traps corrected
- Space weighted by unit marks
- Charts from the book's own data
- Traps corrected
- Space weighted by unit marks
- Charts from the book's own data
- Traps corrected
- Space weighted by unit marks
- Charts from the book's own data
- Traps corrected
- Space weighted by unit marks
- Charts from the book's own data
- Traps corrected
- Space weighted by unit marks
- Charts from the book's own data
- Traps corrected
- Space weighted by unit marks
- Charts from the book's own data
- Traps corrected
- Space weighted by unit marks
- Charts from the book's own data
- Traps corrected
- Space weighted by unit marks
- Charts from the book's own data
- Traps corrected
- Space weighted by unit marks
- Charts from the book's own data
- Traps corrected
Chapter summary
Key ideas & terms
- Correlation
- The statistical relationship between two variables, measuring the direction and intensity of their co-movement (covariation, not causation).
- Positive correlation
- A relationship in which two variables move in the same direction, such as income and consumption.
- Negative correlation
- A relationship in which two variables move in opposite directions, such as price and demand.
- Scatter diagram
- A graph of paired values of two variables that shows the direction and closeness of their relationship without a numerical value.
- Karl Pearson's coefficient
- A numerical measure of the degree of linear correlation, lying between
and and free of units. - Spearman's rank correlation
- A measure of correlation based on the ranks of items, useful for qualitative data and data with extreme values.
Extra questions & answers
What does correlation measure?
Correlation measures the direction and the intensity of the relationship between two variables, that is, their covariation, but it does not by itself establish causation.
Distinguish between positive and negative correlation.
In positive correlation both variables move in the same direction, like income and consumption; in negative correlation they move in opposite directions, like the price of a good and its demand.
Why does correlation not imply causation?
Two variables may move together by mere coincidence (spurious correlation) or because both are influenced by a hidden third variable, so a high correlation alone cannot prove that one causes the other.
What is a scatter diagram and what does it show?
A scatter diagram plots the paired values of two variables as points and reveals the direction and closeness of their relationship; if all points lie on a straight line the correlation is perfect.
Write the formula for Karl Pearson's coefficient of correlation.
State the properties of Karl Pearson's coefficient of correlation.
It has no unit, lies between
What does the sign and magnitude of r indicate?
A positive r shows the variables move together and a negative r shows they move oppositely, while the closer the magnitude is to one the stronger the linear relationship and the closer to zero the weaker.
When is Spearman's rank correlation used?
When variables can be ranked but not measured, when the characteristics are qualitative like beauty or honesty, when the relationship is clearly non-linear, and when the data contain extreme values.
Write the formula for Spearman's rank correlation.
How are repeated ranks handled in Spearman's method?
Tied items are given the mean of the ranks they would otherwise occupy, and a correction factor