Organisation of Data — Class 11 Economics
Statistics for Economics · Chapter 3
CBSE Class 11 community
View all
 2
2- Economics
 7
7- Mathematics
- Physics
- + 3 more
- Physics
- Chemistry
- + 3 more
 7
7- Accountancy
- Business Studies
- + 3 more
- Accountancy
 2
2- हिंदी
 2
2- हिंदी
 2
2- Chemistry
 2
2- Political Science
 2
2- اردو
- Urdu Elective
 2
2- हिंदुस्तानी संगीत
 2
2- Home Science
 2
2- Hornbill
- Snapshots
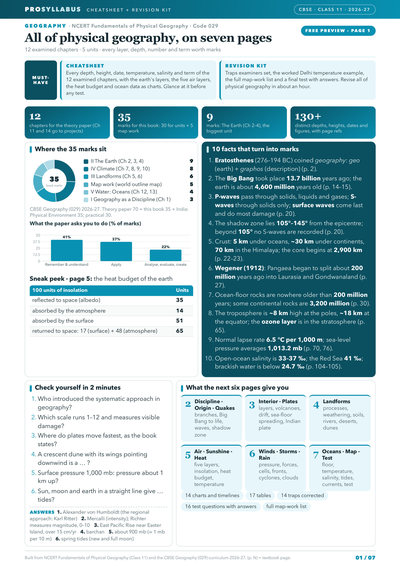
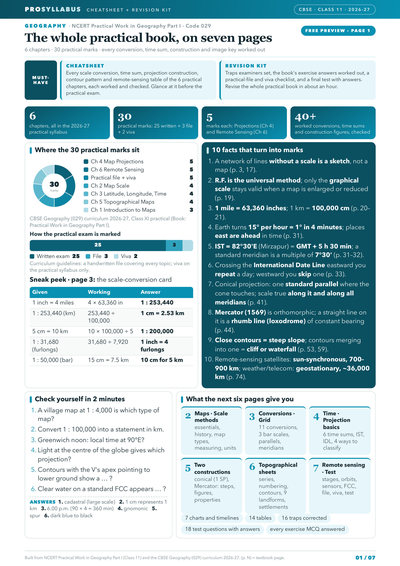 3
3- Geography
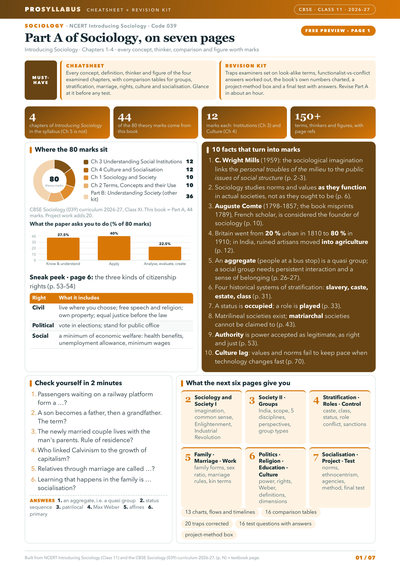
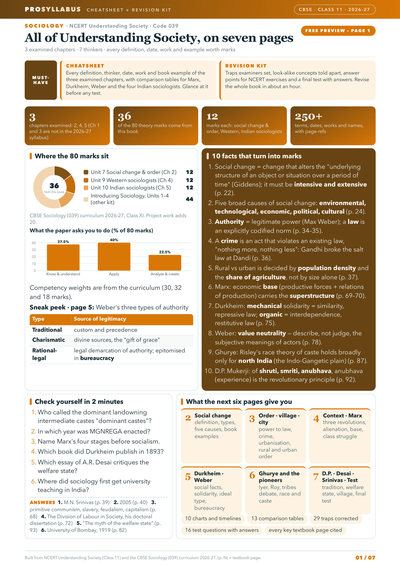 2
2- Sociology
- Physics
- Space weighted by unit marks
- Charts from the book's own data
- Traps corrected
- Space weighted by unit marks
- Charts from the book's own data
- Traps corrected
- Space weighted by unit marks
- Charts from the book's own data
- Traps corrected
- Space weighted by unit marks
- Charts from the book's own data
- Traps corrected
- Space weighted by unit marks
- Charts from the book's own data
- Traps corrected
- Space weighted by unit marks
- Charts from the book's own data
- Traps corrected
- Space weighted by unit marks
- Charts from the book's own data
- Traps corrected
- Space weighted by unit marks
- Charts from the book's own data
- Traps corrected
- Space weighted by unit marks
- Charts from the book's own data
- Traps corrected
- Space weighted by unit marks
- Charts from the book's own data
- Traps corrected
- Space weighted by unit marks
- Charts from the book's own data
- Traps corrected
- Space weighted by unit marks
- Charts from the book's own data
- Traps corrected
- Space weighted by unit marks
- Charts from the book's own data
- Traps corrected
- Space weighted by unit marks
- Charts from the book's own data
- Traps corrected
- Space weighted by unit marks
- Charts from the book's own data
- Traps corrected
- Space weighted by unit marks
- Charts from the book's own data
- Traps corrected
- Space weighted by unit marks
- Charts from the book's own data
- Traps corrected
Chapter summary
Key ideas & terms
- Classification
- Arranging raw data into groups or classes on the basis of some common criterion.
- Continuous variable
- A variable that can take any value, including fractions, within a range, such as height or weight.
- Discrete variable
- A variable that changes only by finite jumps and takes only certain values, such as the number of students.
- Frequency distribution
- A table showing how the values of a variable are distributed across classes with their frequencies.
- Class mark
- The mid-value of a class, equal to the average of its upper and lower class limits.
- Bivariate frequency distribution
- A table showing the joint frequency distribution of two variables together.
Extra questions & answers
What is classification of data and why is it needed?
Classification arranges raw data into groups or classes by some criterion; it brings order to disorganised data and makes comparison, location and statistical analysis easier.
Distinguish between chronological and spatial classification.
Chronological classification arranges data by time, such as population by years (a time series), while spatial classification arranges data by geographical location, such as the yield of wheat across countries.
Distinguish between a continuous and a discrete variable.
A continuous variable can take any value including fractions within a range, like height; a discrete variable changes only by finite jumps and takes only certain values, like the number of students.
Define class limits, class interval and class mark.
The class limits are the two ends of a class (lower and upper); the class interval is their difference; the class mark is their mid-value,
Distinguish between the inclusive and exclusive methods.
In the inclusive method both class limits are counted within the class, while in the exclusive method an item equal to a class limit is placed in the next class so one limit is excluded.
What is a frequency distribution?
A comprehensive table that shows how the different values of a quantitative variable are distributed across classes along with their corresponding class frequencies.
Why is an adjustment made in class intervals for continuous data?
When inclusive classes leave a gap between the upper limit of one class and the lower limit of the next, half the gap is subtracted from lower limits and added to upper limits to restore continuity.
Explain loss of information in classified data.
When data are grouped, individual observations lose significance because every value in a class is treated as equal to the class mark, so the actual values are no longer used in calculations.
What is a frequency array?
The classification of a discrete variable in which the frequency is shown against each integral value of the variable, such as the number of households of each size.
What is a bivariate frequency distribution?
A table showing the joint frequency distribution of two variables, with one variable in columns and the other in rows and each cell showing the corresponding frequency.