Statistics — Class 10 Mathematics
Mathematics · Chapter 13
CBSE Class 10 community
View all
 12
12- Mathematics
- Science
- + 10 more
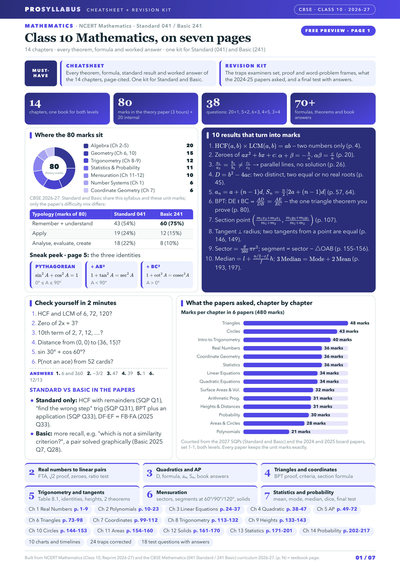
- 70+ formulas and theorems
- Board-paper chapter counts
- 24 traps corrected
 4
4- History
- Economics
- + 2 more
 2
2- First Flight
- Footprints without Feet
- Equations and formulas
- Book tables as charts
- Traps corrected
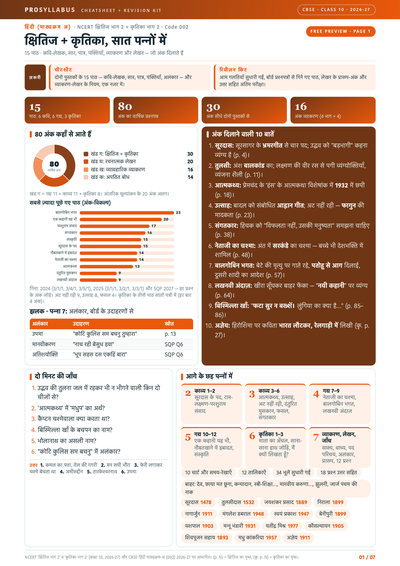
- 15 पाठ
- व्याकरण
- लेखन प्रारूप
- HTML & CSS examples
- Protocol tables
- Cyber ethics
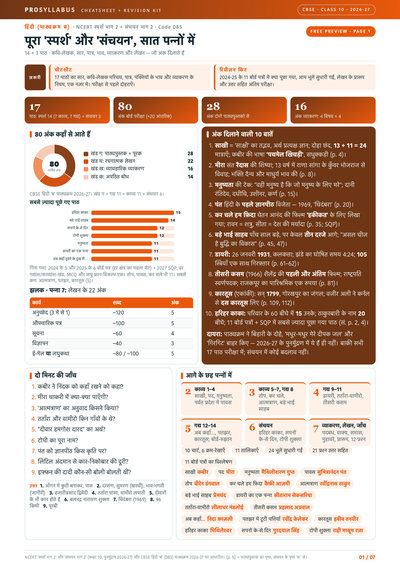
- 17 पाठ
- व्याकरण
- लेखन प्रारूप
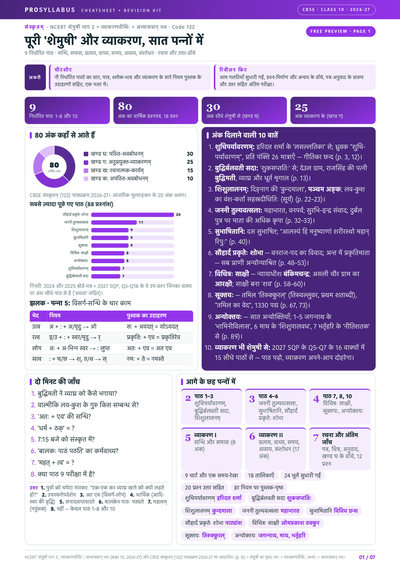
- 9 पाठ
- सन्धि-समास
- प्रत्यय
Chapter summary
Key ideas & terms
- Mean
- The average value of the data.
- Median
- The middle value that divides ordered data into two halves.
- Mode
- The most frequently occurring value (or modal class).
- Empirical relationship
.
Extra questions & answers
State the empirical relationship between mean, median and mode.
Name three methods to find the mean of grouped data.
Direct method, assumed-mean method, and step-deviation method.
Name the three measures of central tendency.
The mean, the median and the mode.
Name the methods of finding the mean of grouped data.
The direct method, the assumed-mean (deviation) method and the step-deviation method.
Write the formula for the median of grouped data.
Write the formula for the mode of grouped data.
State the empirical relationship between mean, median and mode.
The mean of 5 numbers is 18. If one number is removed, the mean becomes 16. Find the removed number.
Sum of 5 numbers
What is a cumulative frequency?
The running total of the frequencies up to a given class, used to draw an ogive and to find the median.
What does an ogive help to find?
The median of grouped data graphically, as the x-coordinate of the point where the two cumulative frequency curves meet (or where
Activity 1 :
From the Table 13.3 find the mean by taking each of
Using the assumed mean formula,
Activity 2 :
1. Collect the marks obtained by all the students of your class in Mathematics in the latest examination conducted by your school. Form a grouped frequency distribution of the data obtained.
A model grouped frequency distribution is: marks
2. Collect the daily maximum temperatures recorded for a period of
A model grouped frequency table is: temperature in
3. Measure the heights of all the students of your class (in cm) and form a grouped frequency distribution table of this data.
A model grouped frequency distribution is: height in
EXERCISE 13.1
1. A survey was conducted by a group of students as a part of their environment awareness programme, in which they collected the following data regarding the number of plants in
The class marks are
2. Consider the following distribution of daily wages of
Take the assumed mean
3. The following distribution shows the daily pocket allowance of children of a locality. The mean pocket allowance is ₹
The class marks are
4. Thirty women were examined in a hospital by a doctor and the number of heartbeats per minute were recorded and summarised as follows. Find the mean heartbeats per minute for these women, choosing a suitable method. Number of heartbeats per minute:
The class marks are
5. In a retail market, fruit vendors were selling mangoes kept in packing boxes. These boxes contained varying number of mangoes. The following was the distribution of mangoes according to the number of boxes. Number of mangoes:
The class marks are
6. The table below shows the daily expenditure on food of
The class marks are
7. To find out the concentration of
The class marks are
8. A class teacher has the following absentee record of
The class marks are
9. The following table gives the literacy rate (in percentage) of
The class marks are
Activity 3 :
Continuing with the same groups as formed in Activity 2 and the situations assigned to the groups. Ask each group to find the mode of the data. They should also compare this with the mean, and interpret the meaning of both.
For the illustrative Mathematics-marks data in Activity 2, the modal class is
EXERCISE 13.2
1. The following table shows the ages of the patients admitted in a hospital during a year: Age (in years):
The modal class is
2. The following data gives the information on the observed lifetimes (in hours) of
The modal class is
3. The following data gives the distribution of total monthly household expenditure of
The modal class is ₹
4. The following distribution gives the state-wise teacher-student ratio in higher secondary schools of India. Find the mode and mean of this data. Interpret the two measures. Number of students per teacher:
The modal class is
5. The given distribution shows the number of runs scored by some top batsmen of the world in one-day international cricket matches. Runs scored:
The modal class is
6. A student noted the number of cars passing through a spot on a road for
The modal class is
EXERCISE 13.3
1. The following frequency distribution gives the monthly consumption of electricity of
The cumulative frequencies are
2. If the median of the distribution given below is
Since the total frequency is
3. A life insurance agent found the following data for distribution of ages of
Converting the cumulative frequencies into ordinary frequencies gives:
4. The lengths of
The continuous class intervals are
5. The following table gives the distribution of the life time of
The cumulative frequencies are
6.
The cumulative frequencies are
7. The distribution below gives the weights of
The cumulative frequencies are